Exactly what talent and enablement your team needs. Named, counted, and costed in hours.
Not a readiness score. A decision chain: where you stand, where the week is going, who is genuinely fluent, what is stopping everyone else, and the one move that shifts the most people at once. These are the real screens, from a demo company.
What a leader sees in AI Litmus
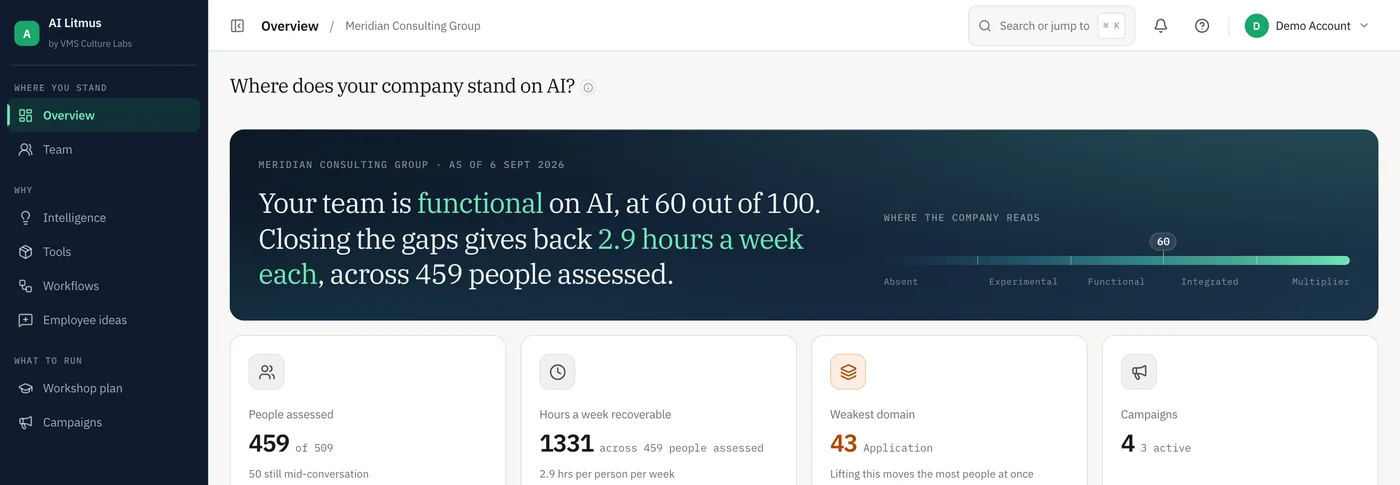
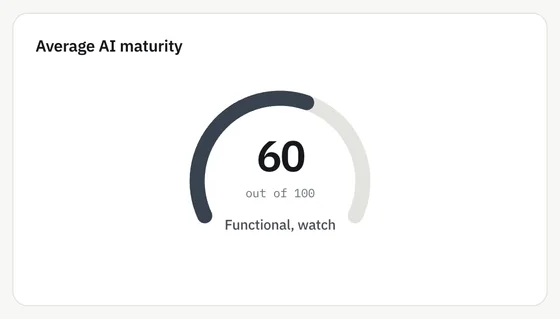
Where the company stands, in one sentence
Their leaderA sponsor can repeat this line in a board meeting without a slide. Under it, the four numbers it rests on, each with its denominator.
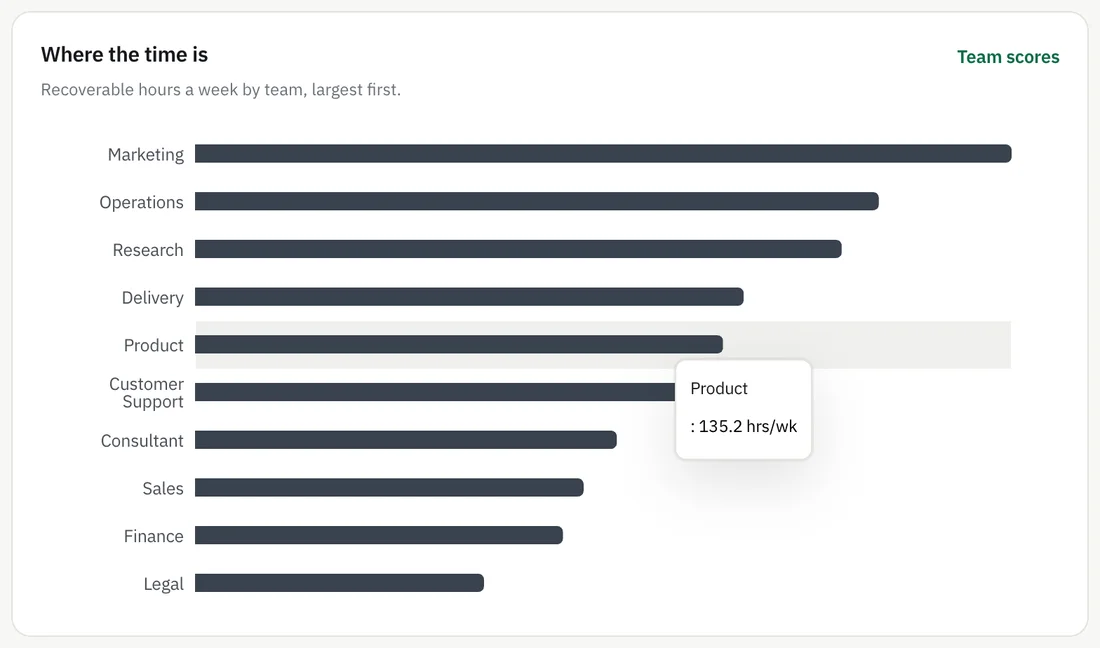
Where the time actually is
Their leaderRecoverable hours a week, ranked by team, largest first. This is the chart that decides which team you start with, and it is almost never the one people expect.
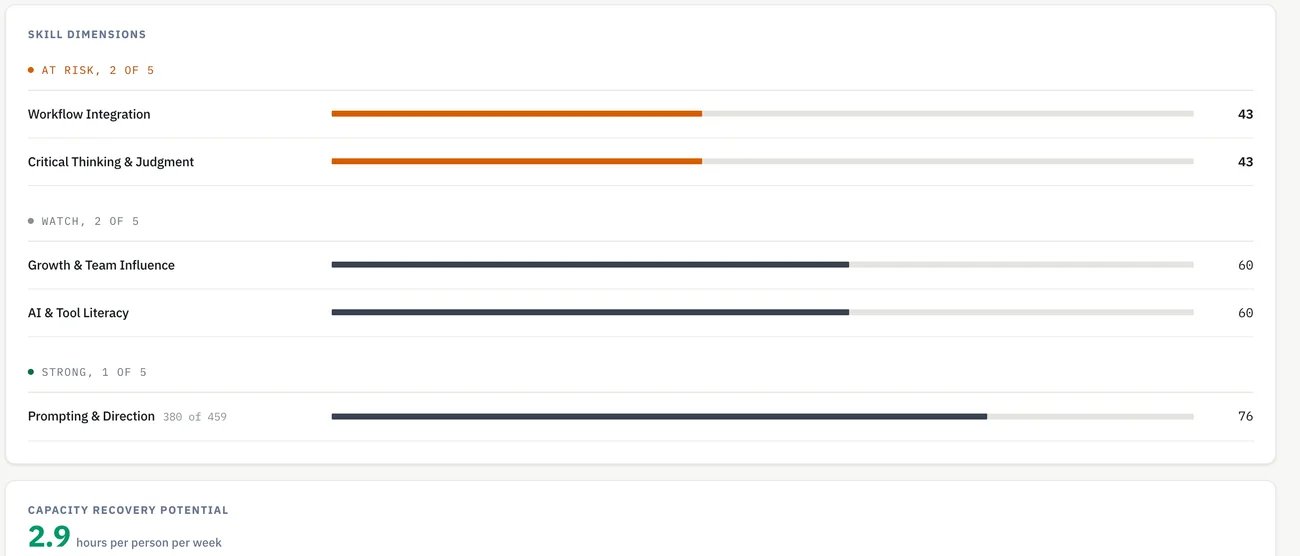
How fluent they really are, skill by skill
Their leaderFive dimensions, sorted into at risk, watch and strong, each against what these roles actually need. The weakest one is where a single workshop moves the most people.
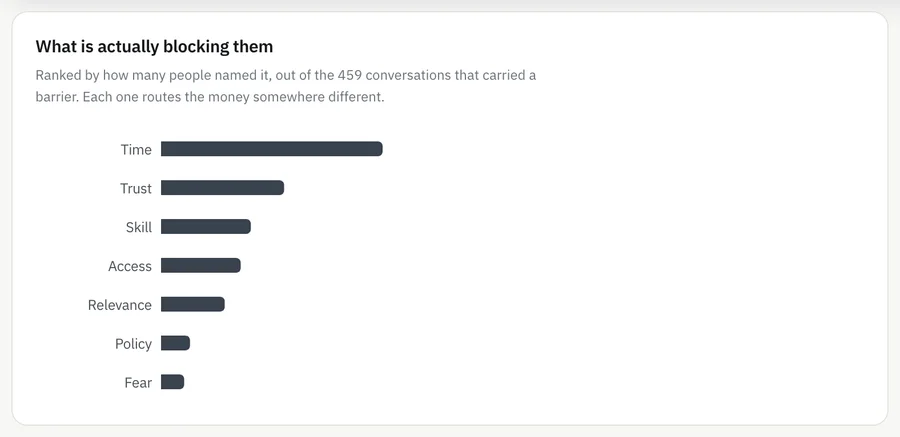
What is actually stopping them
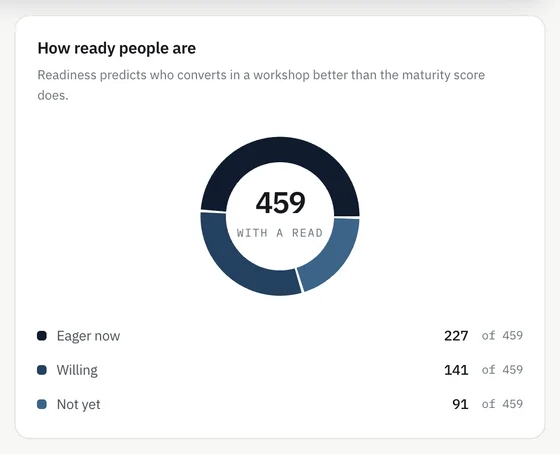
Their leaderRanked by how many people named it, out of the conversations that carried a barrier. Time, trust and skill each route the fix somewhere completely different, and readiness predicts who converts in a workshop better than the score does.
The licences you already pay for that nobody opens
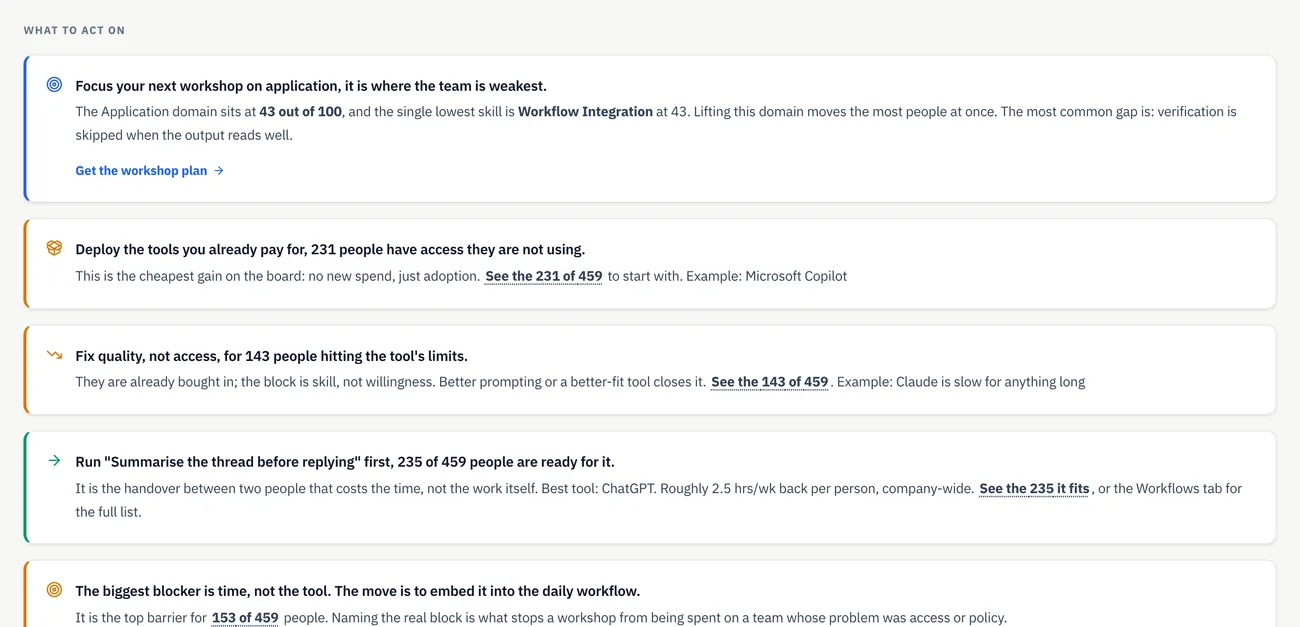
Their leaderThe cheapest win on the board, because it needs no new spend. Not a licence count from the procurement sheet, but what your people actually named when nobody was checking.
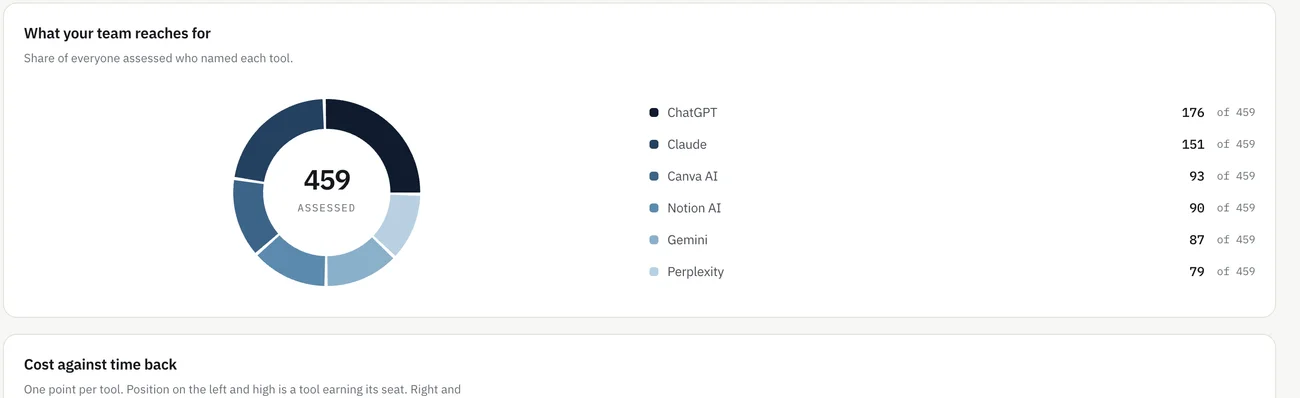
Alongside it sits the list nobody enjoys reading: the licences already on the invoice that nobody was ever shown. On the demo company that is two hundred and thirty one people holding access they have not opened. Fixing it costs nothing.
How the work actually gets done, stage by stage
Their leaderEach team's week in order, with the hours sitting at every stage and the heaviest one flagged. Open a stage and you get what happens there, what to use, what has to stay human, and how much of the team already has AI genuinely in that work.
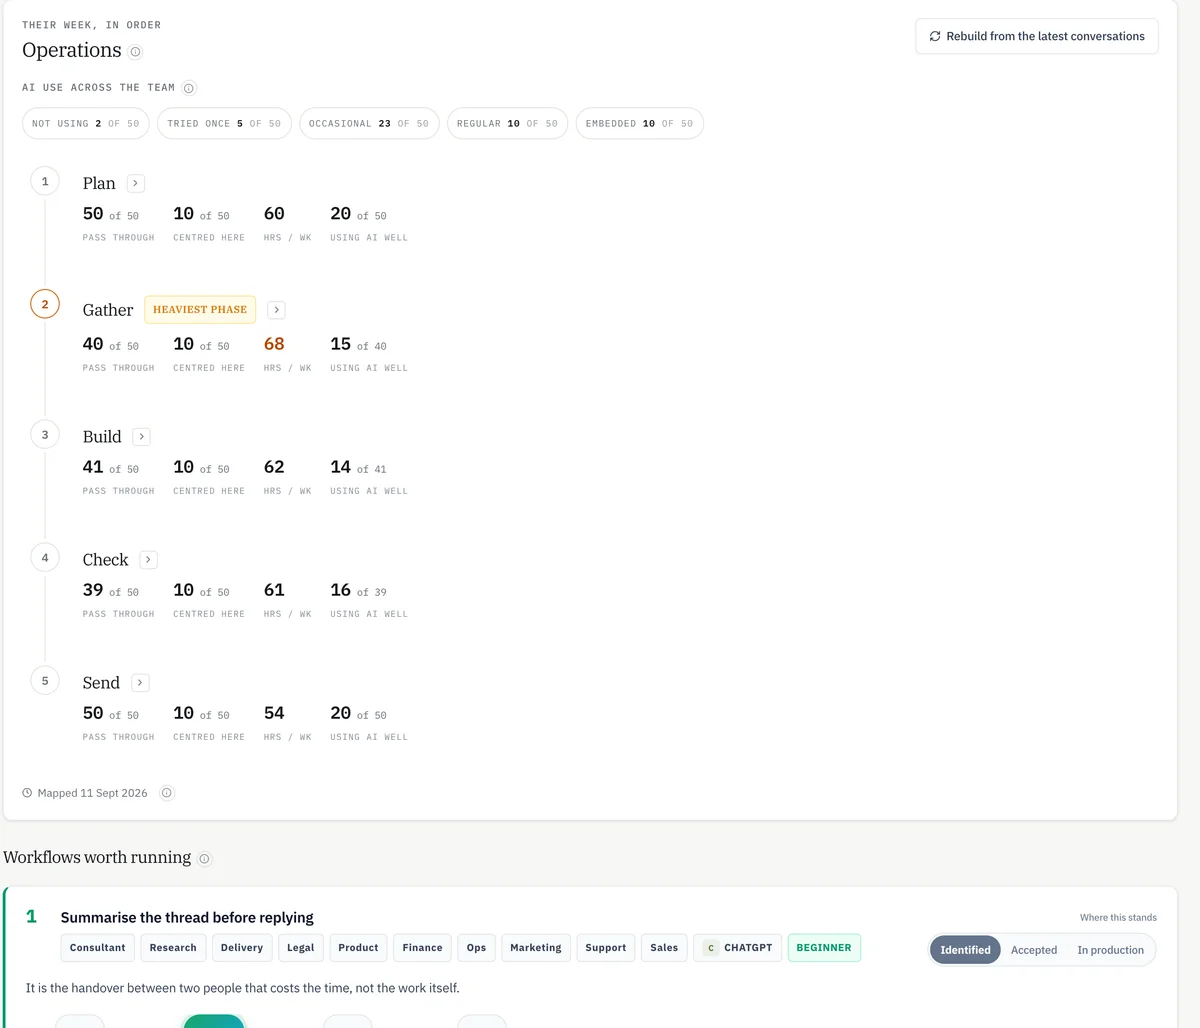
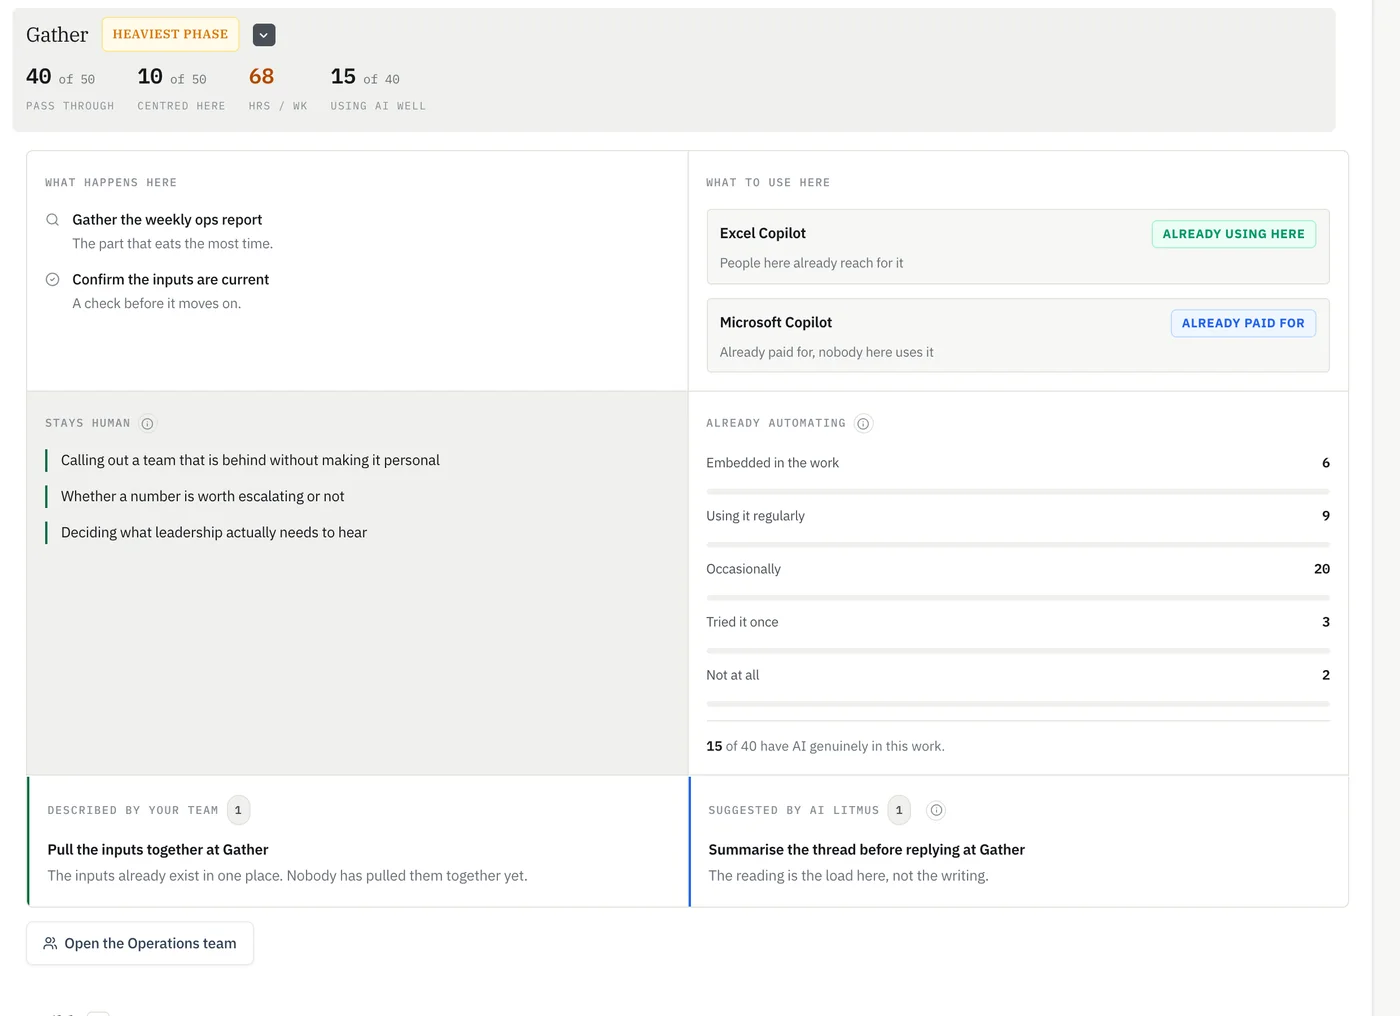
The stays-human column matters as much as the automation one. A plan that automates judgement calls is the plan that gets quietly abandoned three months in.
What to run next, and what your people already asked for
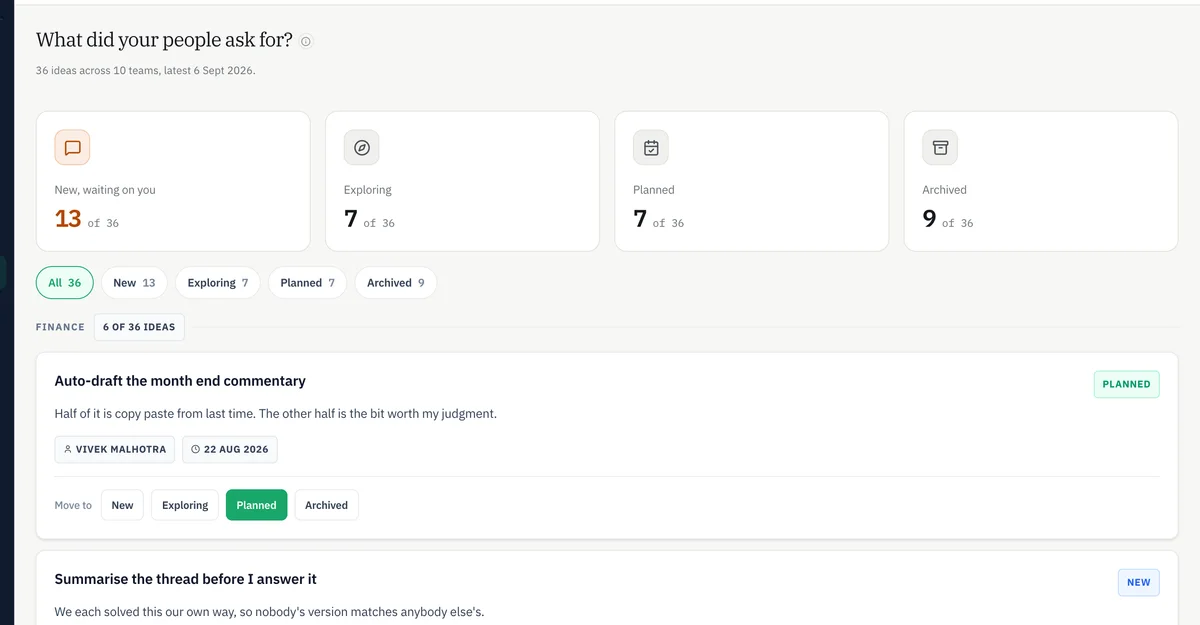
Their leaderRanked actions with the reason attached, each one tied back to the people it came from. Plus the ideas your own team raised in their conversations, which is usually the shortest route to a first win.
And whether any of it moved
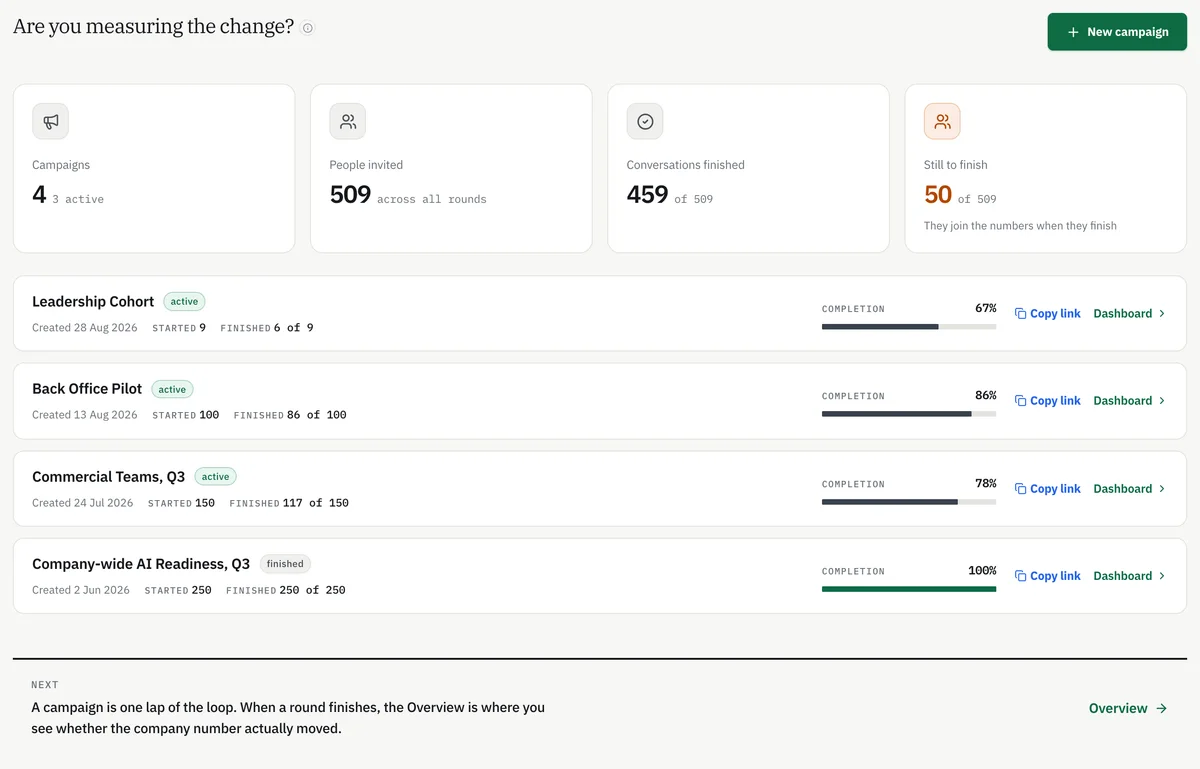
Their leaderRun it again after the workshop. The same people, the same five dimensions, so the second read is a comparison rather than a fresh opinion.
"Good with AI" means nothing until you say good at what, in which job.
Your functions, your roles, the tools you have actually bought and who holds which licence. The read is calibrated to your company, not to an industry average.
What this job needs at this seniority. A salesperson and a support agent doing equally well will score completely differently on the same five dimensions, and they should.
Every conversation already held with people doing that same job feeds the bar. It gets sharper with each one, which is why the second campaign reads better than the first.
One thing this never does: publish a rupee saving. It reports the hours a week that come back, per person and per team, against the licence spend you already carry. Time is the number you can check against a timesheet. A money figure is the number a finance director pulls apart in the first meeting.
Watch this read build for one of your teams.
A private conversation per person, a role-calibrated read of how well they use what you already own, and the exact enablement move for their leader. About two weeks.